
GTA real estate market update: October 2026

Monthly GTA market update from TRREB data via Habistat (Durham, Halton, Peel, Toronto and York), October 2026.
Summary
October pulled both sides back: fewer buyers and fewer sellers. Houses are balanced, condos still favour buyers, and the gap between them widened.
- Houses: balanced. Sales were 11.1% lower than last October, but 15.4% fewer houses came up for sale too. At October's pace it would take about 4 months to sell every house on the market. That is the edge of a balanced market.
- Condos: buyers have the upper hand. Sales were 14.6% lower than last October. At October's pace it would take almost 6 months to sell every condo on the market, longer than a year ago. Buyers have choice and time.
- Prices: below last year. Average prices were down 2.6% for houses and 6.1% for condos compared to last October, and still roughly a quarter below the early-2022 peak. Average prices move with which homes happened to sell that month, so the supply numbers above are the better guide.
- Rates: The Bank of Canada raised its rate to 2.50% on October 28, the first increase since 2023. Next Bank of Canada decision: December 9.
What I'm telling clients this month
Fixed mortgage rates have climbed since spring, and on October 28 the Bank of Canada raised its rate for the first time in three years. Fewer homes came to market in October, and fewer sold. That kept houses balanced. Condo buyers have a bit more leverage than a year ago.
Selling? The right price still sells in the first couple of weeks. The wrong one sits, and in condos it sits longer.
Buying? For houses, well-priced homes are still getting competing offers, so be ready to move. For condos, you have time and room to negotiate.
| Segment | SNLR* | MOI* | Market type |
|---|---|---|---|
| Condos | 33% | 5.9 | Buyer's market |
| Houses | 41% | 4.0 | Balanced market |
What this means: Buyers still have condo options. Sellers need a plan, not hope. Overpriced = unsold.
*SNLR (sales-to-new listings ratio): October sales as a share of the homes newly listed that month. Under 40% favours buyers, over 60% favours sellers. MOI (months of inventory): how many months it would take to sell everything on the market at October's pace. Under 2 favours sellers, 2 to 4 is balanced, over 4 favours buyers.
Detailed report
Houses
3,518 sales
Up 9.4% from September
Down 11.1% from last October
24.2% below a normal October (10-year average)
Condos
1,710 sales
Up 2.2% from September
Down 14.6% from last October
29.3% below a normal October (10-year average)


Average prices vs last October: houses down 2.6%, condos down 6.1%.
Fewer homes sold this October than last, in both segments. Sales are still well below a normal October, especially for condos. Sales often rise from September to October, so the monthly increase is normal. The bigger story is supply. Fewer homes came up for sale. The number of homes on the market is lower than a year ago, though still higher than normal.
Well-priced, move-in-ready houses still get competing offers in the first week or two, especially in popular Toronto neighbourhoods. Overpriced homes sit, house or condo.
8,494 houses came up for sale in October. That is 15.4% fewer than last October (roughly 1,550 fewer homes) and 6.6% below a normal October.
5,135 condos came up for sale, 11.3% fewer than last October (roughly 650 fewer) and 0.9% below a normal October.
Fewer new listings means sellers are holding off too, not just buyers. Fewer homes sold, but fewer came up for sale. That is why houses did not tip toward buyers.


Sales-to-new listings ratio: houses 41%, condos 33%. In plain terms: October house sales equalled 41 out of every 100 houses newly listed that month. For condos it was 33 out of 100. Between 40 and 60 is balanced. Houses were at 39 a year ago. They are back at the edge of balanced. Condos were at 35 a year ago and are now at 33. That favours buyers.


Houses for sale (active listings): 13,992.
Down 16.6% from last October
22.0% above a normal October

Condos for sale (active listings): 10,073.
Down 8.4% from last October
39.0% above a normal October

Months of inventory is how long it would take to sell everything on the market at the current sales pace. Under 2 months favours sellers, 2 to 4 is balanced, over 4 favours buyers.
Houses: 3.98 months, just inside balanced. Down from 4.24 last October and from 4.66 in September.

Condos: 5.89 months, a buyer's market. Up from 5.49 last October, down from 6.31 in September.

Houses moved back into balanced after a September that leaned toward buyers, and are tighter than a year ago. Condos improved from September but still favour buyers, more than a year ago. The gap between houses and condos widened.
Real estate is local, and some areas will sell faster and at higher prices than others compared to the average numbers in this report. Before deciding to buy or sell, review market trends in your specific area, neighbourhood, street and building.
Mortgage rates
Approximate ranges as of November 7, 2026. Rates change daily.
- Prime rate (the base for variable mortgages): about 4.70%
- Stress test: you must qualify at 5.25% or your rate plus 2%, whichever is higher
- 5-year fixed: insured (under 20% down) about 4.30% to 4.60%; uninsured (20% or more down) about 4.50% to 4.90%
- 5-year variable: insured about 3.65%; uninsured about 4.10%
- Bank of Canada rate: 2.50%, raised by 0.25 on October 28, the first increase since July 2023. Next decision: December 9, 2026.

Bank of Canada policy rate: 2.50%. Source: bankofcanada.ca
Fixed mortgage rates follow the 5-year Government of Canada bond yield, not the Bank of Canada rate. That yield eased to about 3.4% in early November (3.39% on November 5), from about 3.6% through October. It reacts to both the Canadian and US economies.

Canada 5-year government bond yield
Macro statistics
Inflation, September 2026

Total CPI 3.1%, up from 3.0% in August. Core inflation, which the Bank of Canada watches most, is around 1.9%.
Next update: November 16, 2026.
Unemployment, October 2026
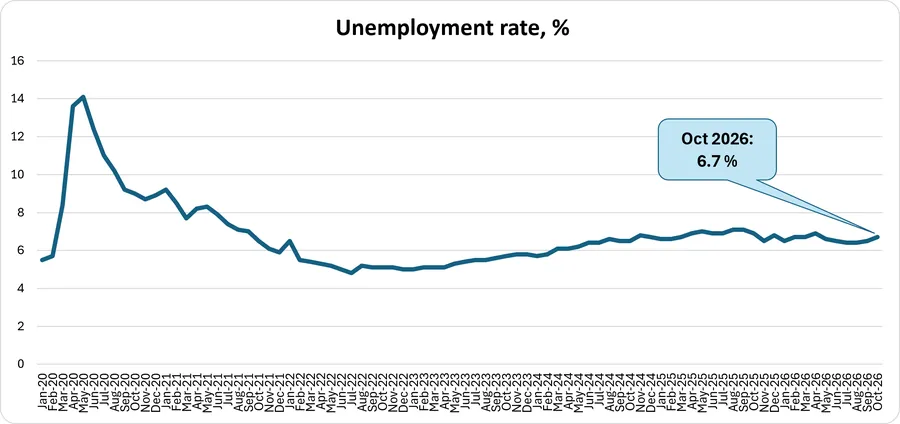
6.7%, up from 6.5% in September.
Next update: December 4, 2026.
What is happening on your street?
Email me your postal code and I will tell you what I see. Renting a condo? See how buying compares, size for size: Rent or buy a condo in the GTA.
Alex Trokoz, Real Estate Agent, Property.ca Inc., Brokerage
647.818.2995 · alextrokoz@property.ca
Sources: TRREB data via Habistat (five GTA regions), October 2026; Bank of Canada; Statistics Canada.
Categories

Agent License ID: 5022789